Gold Slips to Multi-Week Lows on Hotter Inflation and Fed Hike Bets
Gold prices slipped as hotter U.S. inflation data and surging oil prices pushed Federal Reserve rate hike expectations to 92.5%.
By Muhamed Porić
October 5, 2026 at 12:12 PM
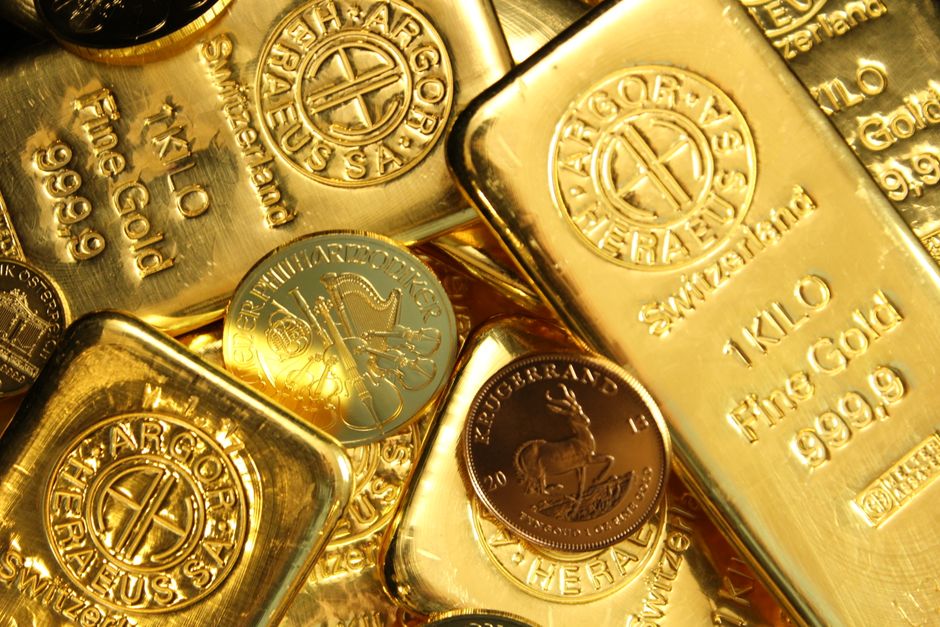
Gold prices slipped to multi-week lows as stronger-than-expected U.S. inflation data and surging crude oil prices ramped up market expectations for an imminent Federal Reserve interest rate hike.
Spot gold dipped 1.2% to settle at $4,298.80 per ounce, while gold futures dropped 1.6% to settle at $4,340.00 per ounce. The pullback reflects a reassessment of monetary policy trajectory as energy costs compound price pressures across the economy.
"We've got crude oil prices that are sharply higher today, which is driving inflation expectations that suggest the major central banks of the world are going to have to tighten their monetary policies to control inflation, and that's bearish for the metals," said Jim Wyckoff, a market analyst at American Gold Exchange, according to a CNBC report.
Surging Rate Hike Probabilities
Market pricing for a Federal Reserve monetary tightening cycle accelerated following the latest macroeconomic releases. According to the CME FedWatch tool, the probability of a Federal Reserve rate hike stood at 92.5%, climbing significantly from 87.3% a day earlier and 59.4% a week prior.
The shifting rate expectations coincided with movement in sovereign debt markets. The benchmark U.S. 10-year Treasury yield briefly touched 5% on Monday, marking its highest level since October 2023.
Consumer Price Index and Macro Drivers
Underlying consumer price data continue to show persistent upward momentum. The Consumer Price Index for All Urban Consumers reached 334.131 as of August 1, 2026, according to FRED economic data.
Higher energy costs and elevated consumer price readings reduce the appeal of non-yielding assets like precious metals, as rising yields increase the opportunity cost of holding bullion. Elevated interest rates strengthen sovereign bond yields, drawing capital away from commodities.
Technical Chart Patterns
Technical market indicators point to potential further downside should current support levels fail to hold. Technical analysts point to developing formations on daily trading charts.
"Chart-wise, gold looks as if it could be forming the right-hand side of a ‘head-and-shoulders’ pattern which, should it complete, could see prices head back down towards $4,000 per ounce," said David Morrison, senior market analyst at Trade Nation, according to CNBC.
Muhamed Porić
Founder and Editor of Embers.
Newsletter
Get Embers in your inbox
The stories that actually moved something, delivered when there's something worth sending, not daily filler.